Overview
Instrumenting your application code should be one of the key Non-Functional Requirements for consideration while building applications in Azure, specifically if they are multi-tenant SaaS-based applications. Depending on the size and nature of your application, the following areas of instrumentation should be considered:
- Diagnostic Logging
- Exception Log
- Verbose Log
- Custom Performance Metrics
- Application Performance Metrics
- Service Metering
Diagnostics
Diagnostic Logging in very simple terms could be logging all exceptions that occur in your application. You can create a very simple LogService implementation using log4net. The service can expose methods like Debug, Error, Fatal, Warn, and Info to address various instrumentation needs. The log4net, ILog interface exposes capabilities for each of these as shown in the code below
readonly ILog _logger; static LogService() { XmlConfigurator.Configure(); } public LogService(Type logClass) { _logger = LogManager.GetLogger(logClass); } /// /// Log a message object with the Fatal level. /// /// The error message. public void Fatal(string errorMessage) { if (_logger.IsFatalEnabled) _logger.Fatal(errorMessage); } The code block above shows an example of a Fatal log.
In addition to logging the exceptions caught in the catch block, it is a good idea to provide support for verbose logging and enable it for capturing detailed code flow if needed. To capture verbose log, you must instrument every method entry, including the parameters passed and return values. Important business rules within methods should also be instrumented as deemed necessary.
You can use the Info method to create specific logging entries such as “Method Entry”, “Method Exit” with each of these entries augmented by the parameters passed and returned respectively.
Note that Windows events are captured and logged in the WADLogsTable and WADWindowsEventsLogsTable table stores. They provide additional diagnostic information into issues occurring in the configured roles.
Performance Metrics
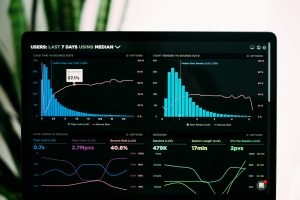
Performance metrics are usually twofold. You can use the Telemetry SDK to create custom KPI to be monitored using App Insights. If you do not have App Insights, you can actually create a simple performance monitor for your modules, using a StopWatch and capturing the ElapsedMilliseconds for the operations you intend to participate in a performance session. The key here would be, however, to be asynchronous while capturing performance data. The following class shows a simple PerfLog entity.
public class PerfLog : TableEntity { private string operationName; public string OperationName { get { return operationName; } set { operationName = value; this.RowKey = string.Format("{0}_{1}", value, this.RowKey); } } public int TenantId { get; set; } public string ParamValuesPassed { get; set; } public int OperationExecutionDuration { get; set; } public string ResultInfo { get; set; } public int RecordsReturned { get; set; } } Second, you can use the Windows Azure Performance Diagnostics part of Windows Azure Diagnostics (WAD) to create and use performance counters in your application. The WAD framework is built using the Event Tracing for Windows (ETW) framework and the performance counter logs are stored in the WADPerformanceCountersTable storage table. It is possible to create a custom diagnostic plan for each role using Visual Studio. The following figure illustrates the performance configuration.

Service Metering
If you are building a multi-tenant SaaS-based application, Service Metering is important to gain an understanding of usage and bill customers accordingly. The recently released Cloud Design Patterns guidance by the Patterns and Practices team elaborates on the Service Metering Guidance. Please note that there is no default mechanism in Azure to perform metering by tenant. The architecture needs to take care of tenant-based metering. An early example of this was released in the Cloud Ninja Metering Block and you can explore the source to understand a tenant metering implementation and apply it in your application. The source is available at http://cnmb.codeplex.com/SourceControl/latest.
The Azure Management Portal provides you usage details on each resource and is a great way to find out the resource allocation on roles. The following figure illustrates:

Summary
Instrumentation is a multi-pronged approach for applications hosted in Azure, and you need to consider the size, scalability, multi-tenacity, billing, and other non-functional factors into consideration while planning for instrumentation and logging.
Charlie has over a decade of experience in website administration and technology management. As the site admin, he oversees all technical aspects of running a high-traffic online platform, ensuring optimal performance, security, and user experience.


